RCA Rt ❯ Toolbox Scalability Real life use ⇢ 5WHYS+A3 12STEPS+CauseTree 7QT ⇢ Training
Toolbox
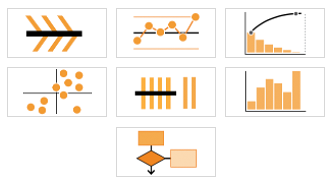

Quality Tools
Every issue has different characteristics and different quality tools will be appropriate to gather and analyse data. Teams of people who can apply elements of these seven tools will find that their ability to solve problems is greatly enhanced and they can quickly move from opinions to facts. RCA Rt has a special training course that covers 7 Quality Tools in addition to 5WHYS and 12 STEPS + CauseTree.
1. Ishikawa or fishbone diagram.
Also called fishbone diagrams or herringbone diagrams. Diagrams are created by Kaoru Ishikawa, that graphically show potential causes of a specific event. Commonly used in brainstorming.
2. Check Sheet.
Normally a form that is structured in a way that assists in gathering data or executing a procedure. Simple counting required.
3. Control Chart.
A graph that is used to illustrate how something changes over a time period. They are used to determine if a manufacturing or business process is in a state of statistical control.
4. Histogram.
A common graph used to show how often various things happen in a set of data (sometimes called frequency distributions).
5. Pareto Chart.
A bar graph arranged to show the most important issues. It helps identifying the 80:20 rule in Pareto's principle, which says that 20% of causes (vital or significant few) are responsible for 80% of effects.
6. Scatter Diagram.
Graphs pairs of data with one variable on each axis. Excellent for searching for patterns and comparisons.
7. Stratification, Flow Chart and Run Chart.
Stratification seeks to find a hidden variable in a dataset. Run Charts plot the changes in a variable over time. Flow charts are a representation of a process.
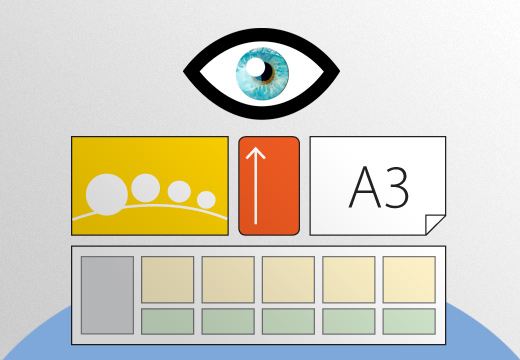
Visual Devices
Visual devices help visually communicate the priorities during the investigation. They are specially designed by us, and are unique in the entire problem solving industry. Our Visual Devices help you in all problem solving investigations, regardless if you use the RCA Rt our method or not.

RCA Rt 5WHYS Pocket pad (English).
A pad with 10 individual sheets. Ideal to practice 5WHYS out in the field, keep them in your pocket, and use later to communicate with your team members and/or enter them into the RCA2GO web-based issue management software.
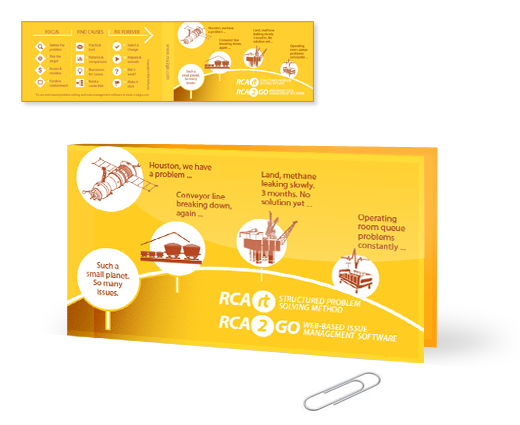
Field Pocket Wallets.
15 cm x 7 cm closed, 30 cm x 7 cm when opened, 2 clear plastic sleeves inside. PVC Pocket sized folder. Slide in it a reminder card, 5WHYS pocket pad, sticky pads, business card, etc. Keep your 5WHYS routine investigations neat and in one place.
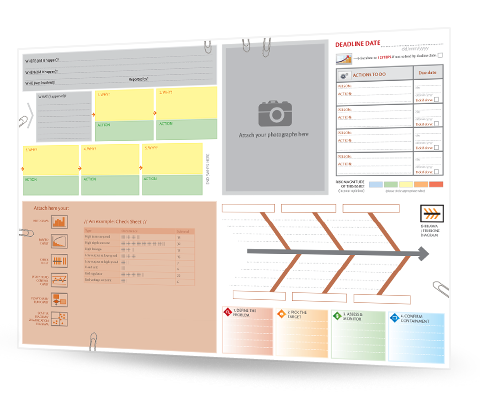
A3 Sheet.
A powerful visual communication tool. Applying 5WHYS and documenting thoughts on an A3 sheet, (5WHYS + A3, or formal 5WHYS) particularly in a team environment, will create improved discipline in focusing on the problem, identification of possible causes and will assist in tracking actions set in place to fix the problem forever.
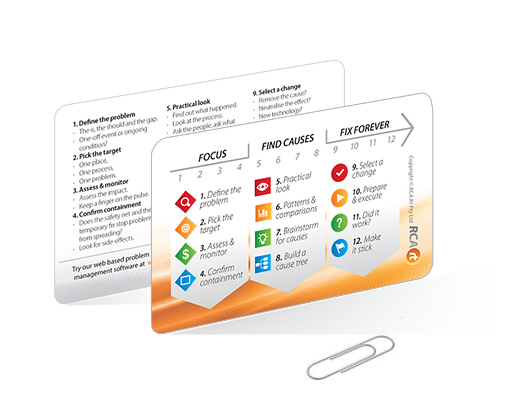
RCA Rt Reminder cards (English).
BC size (90 mm x 50 mm), 2-sided and laminated. Remind yourself of necessary steps to follow, things to remember and procedures that ought to be done in order to complete a successful problem solving.
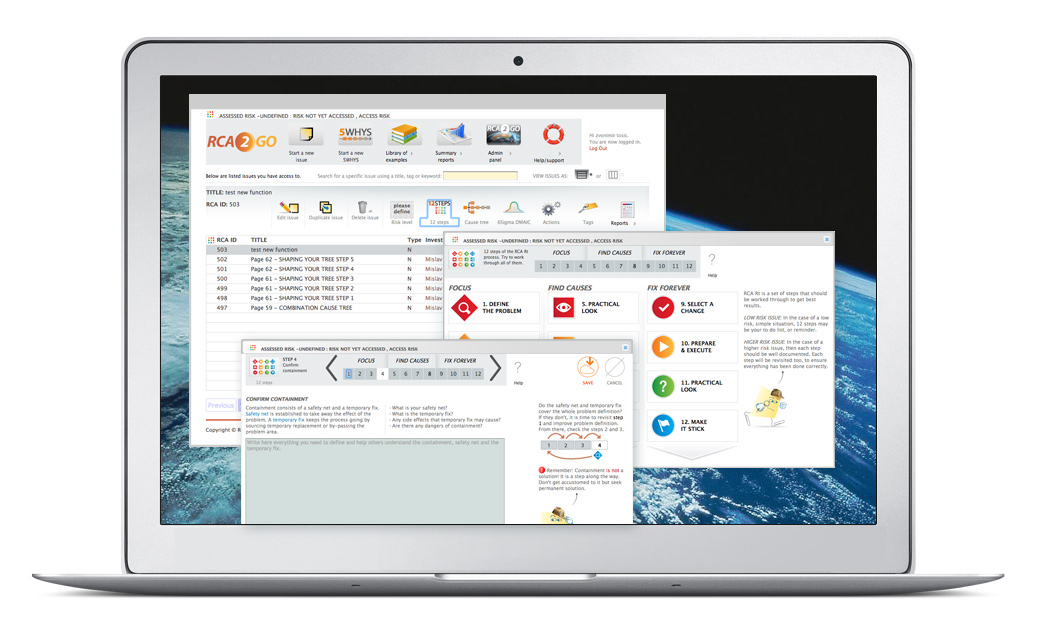
RCA2GO Software
RCA Rt structured problem solving method is complemented with RCA2GO, a web-based rich software toolbox and issue management system available anytime, anywhere. Endless scalability in RCA Rt and accessibility of RCA2GO software empowers your entire team to solve and improve together.
Learn more about the RCA2GO →